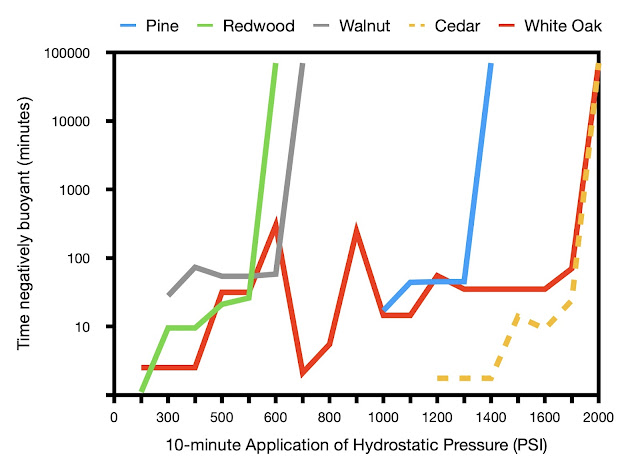
The graph above is the same graph as the last post, but we changed the graph to magnify the small values and shrink the larger values in the y-axis. This type of graph makes it easier to see the changes in the smaller values and is called a semi-log plot.
The graph ignores samples that did not sink at all. Only numbers from sinking samples are plotted. As described in the previous post, the pressure corresponding to forever sinking is P(max).
But.....there is also a P(min).
So, for pine (blue), the first observed sinking is at 1000 PSI and the sample sank for 30 minutes then floated again.
This pressure is P(min) because it is the minimum pressure when sinking happens, for pine. The first data point for each wood species in the plot above is P(min) for that species.
P(min) is very important, as we will see in the next post.

Comments
Post a Comment